PE Portfolio Reporting Automation Toolkit — Free Download
Read Time 12 mins | Written by: Owais Yusuf
How PE firms are eliminating 280+ hours of manual reporting work per year and making decisions on real-time data instead of month-old spreadsheets
THE PROBLEM
Every private equity firm faces the same nightmare: It's day 15 of the month, and you're still chasing portfolio companies for last month's numbers. Your team is drowning in email threads, Excel files with names like "Q4_Report_FINAL_v3_ACTUALLY_FINAL.xlsx," and data that doesn't reconcile between systems.
The cost? Your firm spends an average of 19 days per month pulling together basic portfolio reporting. That's 280+ hours per year spent on manual data collection instead of strategic analysis. And by the time you finish the report, the data is already outdated.
This isn't just inefficient—it's dangerous. Investment decisions are being made on stale data. Board meetings run on incomplete information. LP updates lack the depth they deserve. And your best analysts are spending their time reformatting spreadsheets instead of finding value creation opportunities.
The solution? Automated portfolio reporting through HubSpot's Enterprise platform.
Click here to Download the resources to get started
THE HIDDEN COST
But the real question is: What is this costing YOUR firm specifically?
The answer depends on your portfolio size, team composition, and reporting frequency. A firm with 8 portfolio companies, spending 80 hours per month on reporting at an average hourly cost of $85, wastes over $81,000 annually on manual processes.
And that's just the direct cost. The indirect costs—delayed decisions, missed opportunities, and analyst burnout—are immeasurable.
Use this interactive calculator to discover your exact cost of manual reporting. Adjust the inputs to match your firm's situation and see your potential savings in real-time.
THE SOLUTION FRAMEWORK
The 5-Step Framework for Automated Reporting
The path from manual chaos to automated efficiency follows a proven 90-day framework. This isn't theory—it's the exact process we've used with 20+ PE firms to eliminate manual reporting entirely.
The Five Phases:
1. Data Architecture (Weeks 1-2): Build the foundation with custom HubSpot properties, Business Units for each portfolio company, and data validation rules. This phase defines what you'll track and how you'll track it.
2. Integration Setup (Weeks 3-4): Connect your portfolio companies' financial systems, HR platforms, and operational tools to HubSpot. APIs enable bi-directional data flow without manual intervention.
3. Workflow Automation (Weeks 5-7): Create the workflows that automatically collect data, calculate KPIs, and alert you to variances. This is where the magic happens—where manual processes become automatic.
4. Dashboard Creation (Weeks 8-10): Build the reporting views your team actually needs: executive summaries, portfolio benchmarking, and board-ready presentations that generate automatically.
5. Training & Rollout (Weeks 11-12): Train your team and portfolio company leadership, then launch the system across your entire portfolio with proper support infrastructure.
Click each step to see the detailed timeline, deliverables, and resources required. This interactive roadmap shows you exactly what happens each week of the 90-day implementation.
THE TECHNICAL ARCHITECTURE
How HubSpot Becomes Your Central Data Hub
The technical architecture is simpler than you might think, but it's powerful. HubSpot sits at the center, connected to every portfolio company's systems through APIs and automated workflows.
Data flows in from four main sources:
-
Financial Systems: Revenue, EBITDA, cash flow, and burn rate from QuickBooks, NetSuite, or Xero
-
Sales Data: Pipeline metrics, win rates, and deal velocity from CRMs
-
Operational Systems: Efficiency metrics, costs, and margins from ERP platforms
-
People Data: Headcount, turnover, and compensation from HR systems
All of this data syncs automatically every 15 minutes. HubSpot's Business Units feature ensures complete data segregation between portfolio companies—critical for competitive situations—while still enabling cross-portfolio analytics.
The result? Real-time visibility into every portfolio company without manual data collection.
Hover over each element to see integration details. This architecture handles 8-50 portfolio companies, scaling seamlessly as your portfolio grows through acquisitions.
WHAT TO TRACK
The Essential PE KPIs (and How to Track Them)
Not all metrics matter equally. After working with dozens of PE firms, we've identified the core KPIs that drive value creation decisions:
Financial Performance:
-
Revenue growth (MoM, QoQ, YoY)
-
EBITDA and margin trends
-
Cash flow and runway
-
Budget variance
Customer Metrics:
-
Customer acquisition cost (CAC)
-
Lifetime value (LTV)
-
Churn rate and retention
-
Net revenue retention
Sales Efficiency:
-
Pipeline coverage
-
Win rates by segment
-
Sales cycle length
-
Sales efficiency ratio
Operational Health:
-
Gross margin trends
-
Operating expense ratio
-
Headcount efficiency
The key isn't tracking everything—it's tracking the metrics that matter for YOUR value creation plan, then making them visible in real-time.
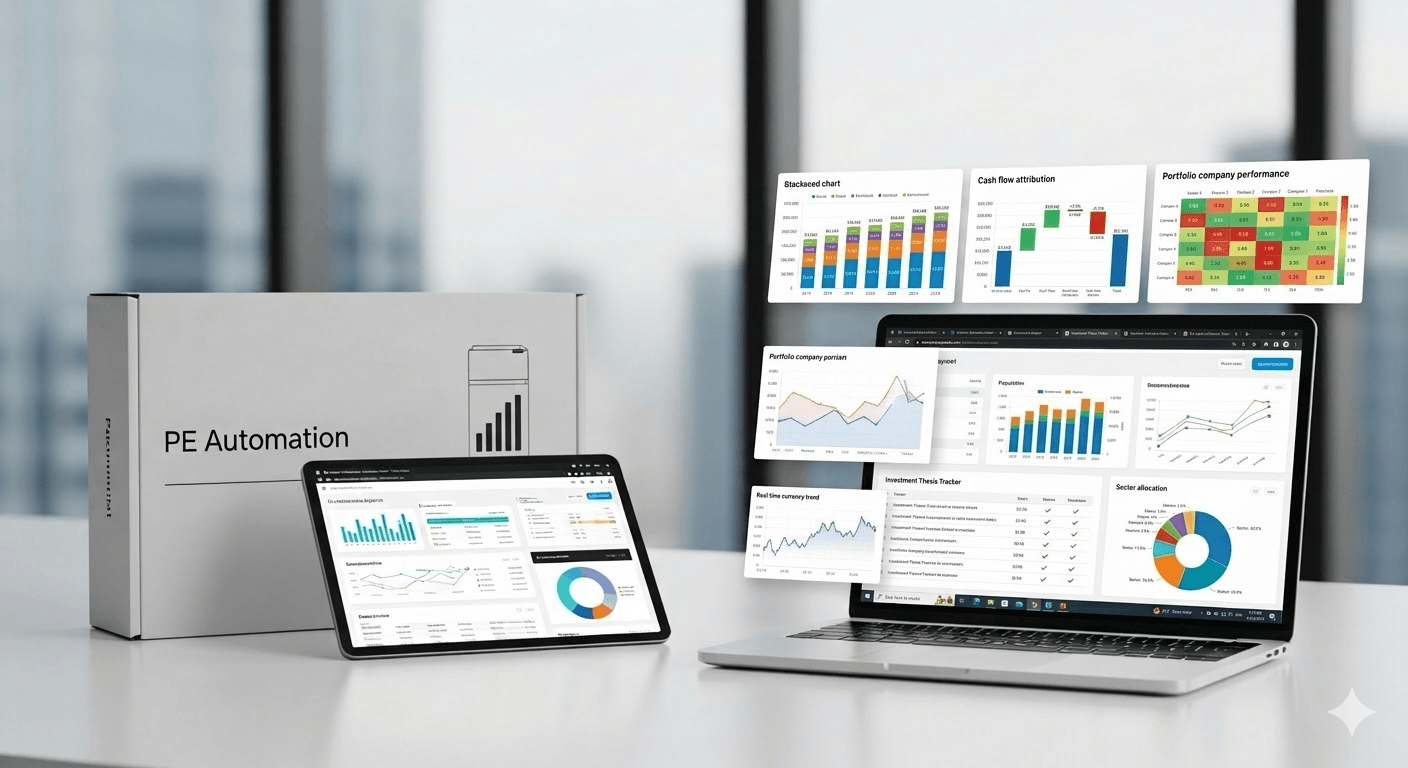
This live dashboard mockup shows real-time portfolio performance. Use the filters to view different time periods and drill into individual companies. Every metric updates automatically—no manual exports required.
But individual KPIs only tell part of the story. The real power comes from cross-portfolio benchmarking - comparing performance across your entire portfolio to identify best practices and underperformers.
When you can see that PortCo C is growing at 31% while PortCo D is at 15%, you can ask: What's C doing differently? Can we replicate it across the portfolio? This is where operational value creation happens.
Select different metrics to see how your portfolio companies rank. Quartile rankings help identify top performers and companies needing intervention. Data remains anonymous to preserve competitive separation.
THE IMPLEMENTATION TIMELINE
Your 90-Day Roadmap to Automation
Implementation follows a structured timeline with clear milestones. While every firm is different, the pattern is consistent: Foundation first (weeks 1-4), then automation (weeks 5-7), then reporting (weeks 8-10), and finally training and launch (weeks 11-12).
The critical success factor? Proper resource allocation. You'll need a dedicated HubSpot admin, an integration specialist, and executive sponsorship. But the investment is minimal compared to the returns.
Most firms see positive ROI within 3-4 months as time savings compound.
Click any week to see detailed tasks, owners, and milestones. This Gantt-style timeline tracks progress and highlights risk checkpoints throughout the implementation.
THE ROI ANALYSIS
The Numbers Don't Lie: Real ROI from Automation
Let's talk about the financial impact—because that's what matters to PE firms.
For a typical firm with 8 portfolio companies, spending 80 hours per month on reporting at a blended rate of $85/hour:
Manual Process Annual Cost: $81,600
Automated Process Annual Cost: $33,760 (includes HubSpot licenses + reduced labor)
Annual Savings: $47,840
Payback Period: 6.4 months
Year 1 ROI: 142%
3-Year Cumulative Savings: $143,520
But these numbers only capture the direct savings. The indirect benefits multiply the value:
-
Faster decision-making: Real-time data enables proactive rather than reactive management
-
Better investment decisions: Access to historical trends and benchmarking data
-
Improved LP relationships: Professional, consistent quarterly updates build confidence
-
Analyst retention: Your best people spend time on analysis, not data entry
-
Scalability: Add new portfolio companies with zero marginal reporting cost
The question isn't whether you can afford to automate—it's whether you can afford not to.
Adjust the inputs to match your firm's exact situation and see your potential savings. The 3-year projection shows how savings compound as your portfolio grows.
COMMON MISTAKES TO AVOID
The 5 Mistakes That Derail Automation Projects
After implementing HubSpot for 20+ PE firms, we've seen the same mistakes repeatedly. Avoid these pitfalls:
1. Over-Complicating the Property Schema
Don't track everything—track what matters. Start with 40-50 core properties, not 200. You can always add more later.
2. Skipping Data Validation Rules
Garbage in, garbage out. Build validation rules upfront to catch errors before they corrupt your dashboards. A 2% error rate is acceptable; 20% is not.
3. Ignoring Change Management
Technology is easy; people are hard. Portfolio company CEOs won't adopt a system they don't understand. Invest in training.
4. Not Planning for Scale
Design your architecture assuming you'll double your portfolio in 2 years. Adding Business Units later is harder than building them upfront.
5. Treating This as an IT Project
This is a business transformation project that happens to use technology. Your head of portfolio operations should own it, not IT.
The firms that succeed treat automation as a strategic initiative with executive sponsorship, dedicated resources, and clear success metrics.
Ready to Eliminate Manual Reporting Forever?
You've seen the problem: 19 days of manual work, $80K+ in wasted costs, and decisions made on stale data.
You've seen the solution: 5-day automated reporting, real-time dashboards, and 74% time savings.
You've seen the roadmap: A proven 90-day implementation process used by 20+ PE firms.
Now it's time to take action.
Your Implementation Checklist
Before you start, make sure you have:
✅ Executive Sponsorship - This needs buy-in from your managing partner or head of portfolio operations
✅ Dedicated Resources - 1 HubSpot admin, 1 integration specialist, 5-10 hours/week from portfolio operations
✅ Clear Success Metrics - Define what success looks like (e.g., "Board reports generated in <5 days")
✅ Portfolio Company Buy-In - CEOs need to understand why this benefits them too
✅ Budget Approval - ~$3,200/year per portfolio company for HubSpot Enterprise
✅ Data Inventory - Document what systems each portfolio company uses today
Three Ways to Get Started
Option 1: DIY Implementation
Use this guide and our downloadable toolkit (below) to implement yourself. Best for firms with strong technical resources and 90 days to dedicate to the project.
Option 2: Guided Implementation
We'll handle the technical setup while your team focuses on change management and adoption. Reduces time-to-value from 90 days to 60 days.
Option 3: Fully Managed Service
We implement everything, train your team, and provide ongoing optimization. Best for firms that want guaranteed results without internal resource drain.
Download the Portfolio Reporting Toolkit
To help private equity firms standardize reporting across portfolio companies, we’ve prepared a practical toolkit you can start using immediately.
This toolkit includes:
📊 HubSpot Property Architecture Template
A structured framework of custom HubSpot properties designed to track key portfolio company KPIs and performance metrics.
📋 90-Day Portfolio Reporting Implementation Checklist
A step-by-step guide outlining the full implementation process, from system setup to automation and dashboard creation.
💰 Executive ROI Calculator (Excel)
A financial model to estimate time savings, cost reduction, and ROI from automating portfolio reporting.
These resources are designed to help PE teams reduce manual reporting, standardize data across portfolio companies, and gain faster visibility into portfolio performance.
Click here to Download the resources to get started
Questions? Let's Talk
Every PE portfolio is different. Your reporting requirements, portfolio company systems, and value creation priorities are unique.
If you're wondering whether this approach will work for YOUR firm, let's have a conversation. We'll review your current process, identify your biggest bottlenecks, and show you exactly how automation would work in your situation.
SCHEDULE A 30-MINUTE STRATEGY CALL
No sales pitch. Just a tactical discussion about your portfolio reporting challenges and how HubSpot automation could solve them.
About Ontrac Solutions
We help private equity firms standardize HubSpot across their portfolio companies. Over the past [X] years, we've implemented automated reporting systems for 20+ PE firms, eliminating thousands of hours of manual work and enabling better, faster investment decisions.
Our clients include private equity firms, operating partners, and portfolio operations teams, managing portfolios of 5 to 50 companies across SaaS, healthcare, and business services industries.
If you're tired of spreadsheet chaos and month-old data, let's talk.